Dashboard
The dashboard is your hub for tracking profits, viewing trading volume, and accessing recent projects.
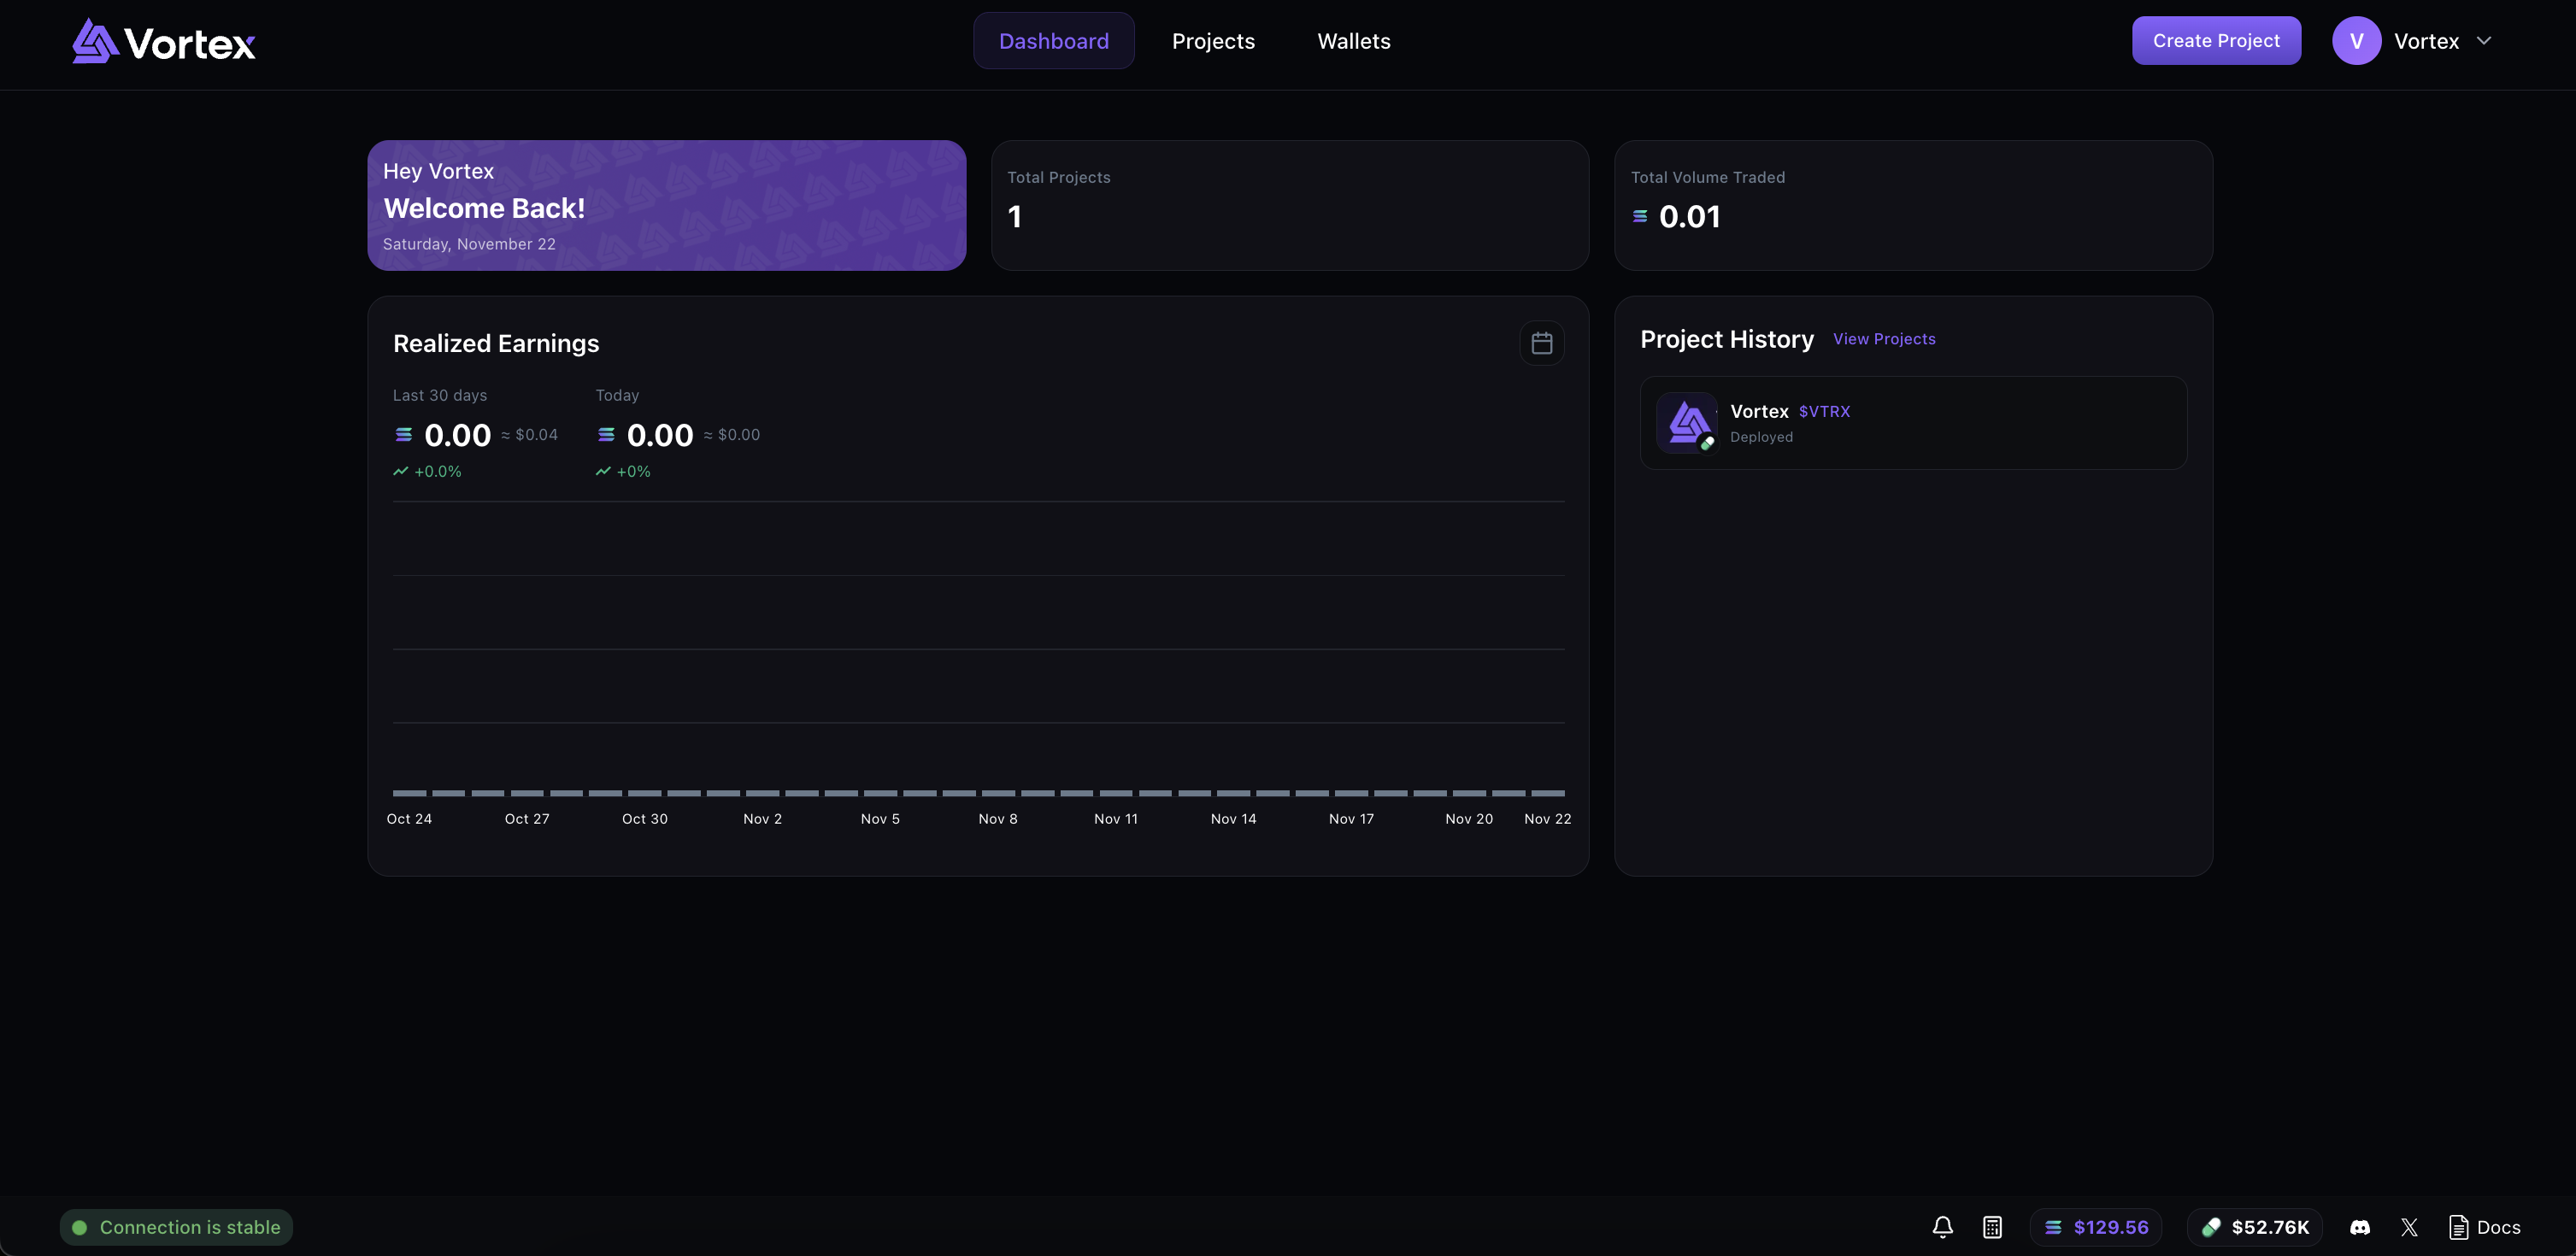
Key Metrics
At the top of the Dashboard, you'll see three cards:
- Welcome Back – Personalized greeting & the current date.
- Total Projects – Number of projects in your account.
- Total Volume Traded – SOL volume from all buy transactions across your projects.
Net SOL Flow
The main chart displays your daily net SOL flow (sells − buys) over the last 30 days:
- Green bars indicate positive net SOL flow days (sells > buys)
- Red bars indicate negative net SOL flow days (buys > sells)
- Hover over any bar to see the exact net SOL flow amount and date
- Click the calendar icon to open a detailed monthly breakdown view
The chart header shows two key metrics:
- Last 30 days – Total net SOL flow (sells − buys) with USD equivalent and percentage vs buys
- Today – Current day's net SOL flow (sells − buys) with USD equivalent
Project History
To the right of the earnings chart, you'll see your recently deployed projects and CTO projects (pending projects are hidden and can be accessed in the /projects page). Each project card shows:
- Token image or icon
- Token name and symbol
- Social links (website, Twitter, Telegram) if added
- Status: "Deployed" for launched tokens or "CTO Started" for CTO projects
Click any project card to open the Swap Manager. Use the arrow buttons to navigate between pages if you have more than 4 projects.
Connected